Present data
Style your map
Use symbols, colors, and labels to make your data easier to read.
Start with the map underneath
Choose a basemap from the control at the bottom of the Layers panel. A quieter background can help your own data stand out. Toggle layers off when you do not need them, and use opacity controls where available to see overlapping data.
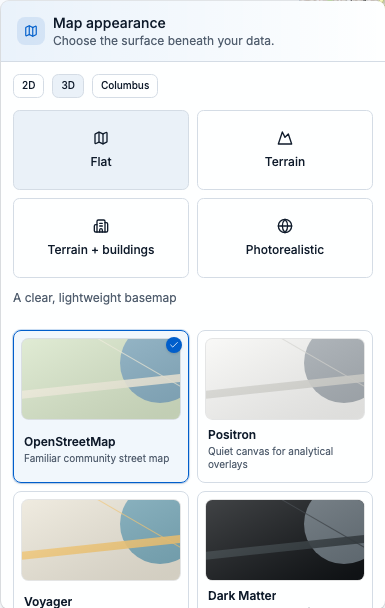
Open Map appearance at the bottom of Layers to compare basemaps. Keep your study boundary and features visible as you choose.
Open the style editor
For a supported catalog data-feed layer, select the layer and choose Edit in the Style section of its details. The editor has Symbology, Labels, and Display tabs. These advanced controls are currently provided by data-feed layers; imported files, ArcGIS layers, and imagery do not all expose this same editor.
- Add a supported source and let some features load so you can judge the result.
- Open its Style editor and leave Live preview on to see your changes on the map.
- Select Apply to keep the style. Cancel or close the editor to discard the preview. Reset to default prepares the default or publisher-recommended style; select Apply to keep that reset.
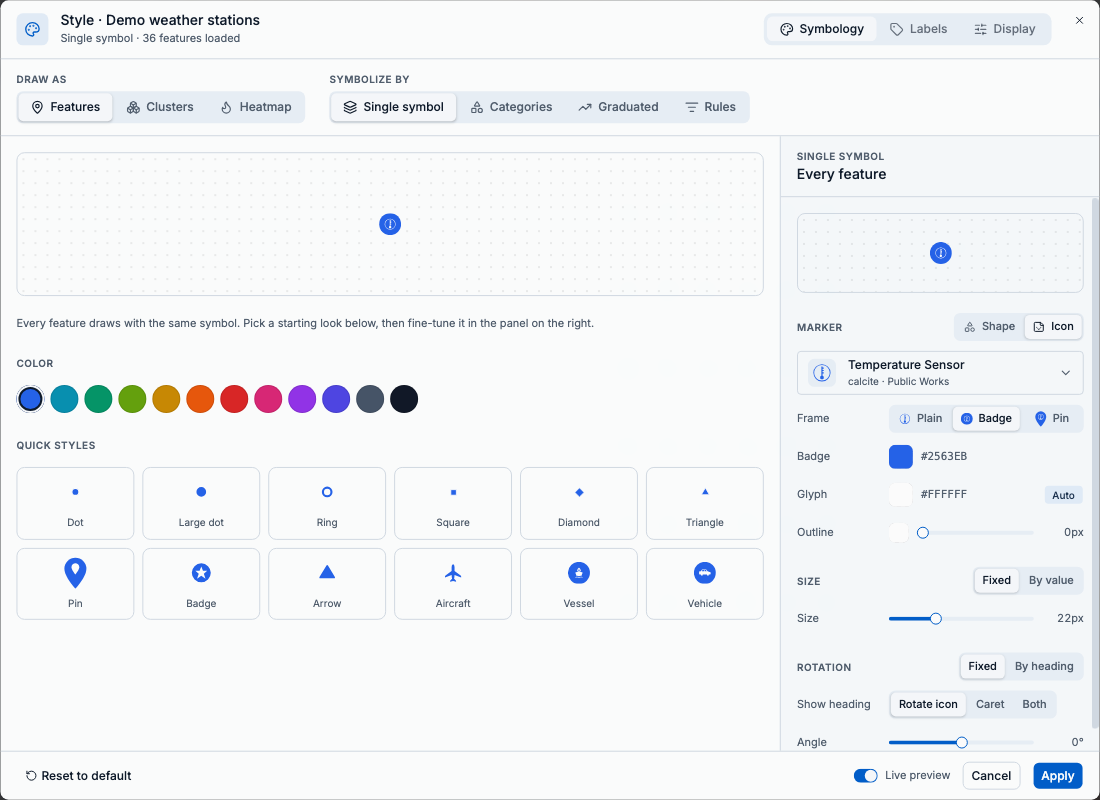
Symbology changes the marks on the map; Labels and Display control text and visibility. Live preview lets you check changes before Apply. Shown with the synthetic sample feed.
Choose how features look
In Symbology, keep Draw as set to Features and choose a method under Symbolize by. Pick the method that answers your question most clearly.
- Single symbol gives every feature the same look. Use it when location matters more than differences between records.
- Categories assigns styles to distinct field values, such as station type. Choose the field, then review the categories and their symbols.
- Graduated varies color or size across numeric ranges, such as temperature. Choose a numeric field, classification method, number of classes, and the colors or sizes to use. Review the range boundaries before applying.
- Rules applies custom conditions in order; the first matching rule wins. Put more specific rules above broader ones.
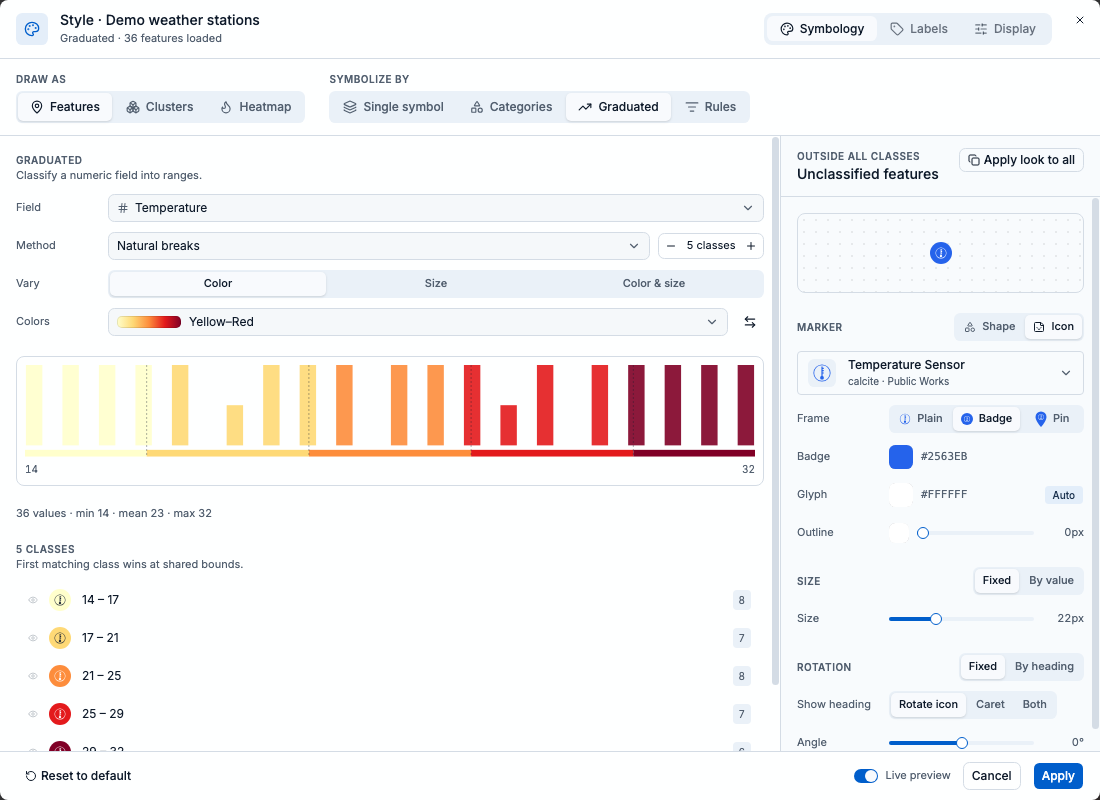
Graduated styling groups Temperature into five classes using natural breaks. Review the histogram, boundaries, and counts before applying the colors.
Make dense data readable
When points overlap, change Draw as to Clusters to combine nearby points into count bubbles. Zoom in to inspect smaller groups. Clusters require point data.
- Heatmap shows a density surface. Review its weighting and appearance controls, then compare the result at more than one zoom level.
- A bright heatmap patch reflects density or the chosen weight. It does not automatically mean a higher rate or greater risk.
- Styling changes presentation. Use a query to control which records belong in the layer, or Field stats to check the values behind the picture.
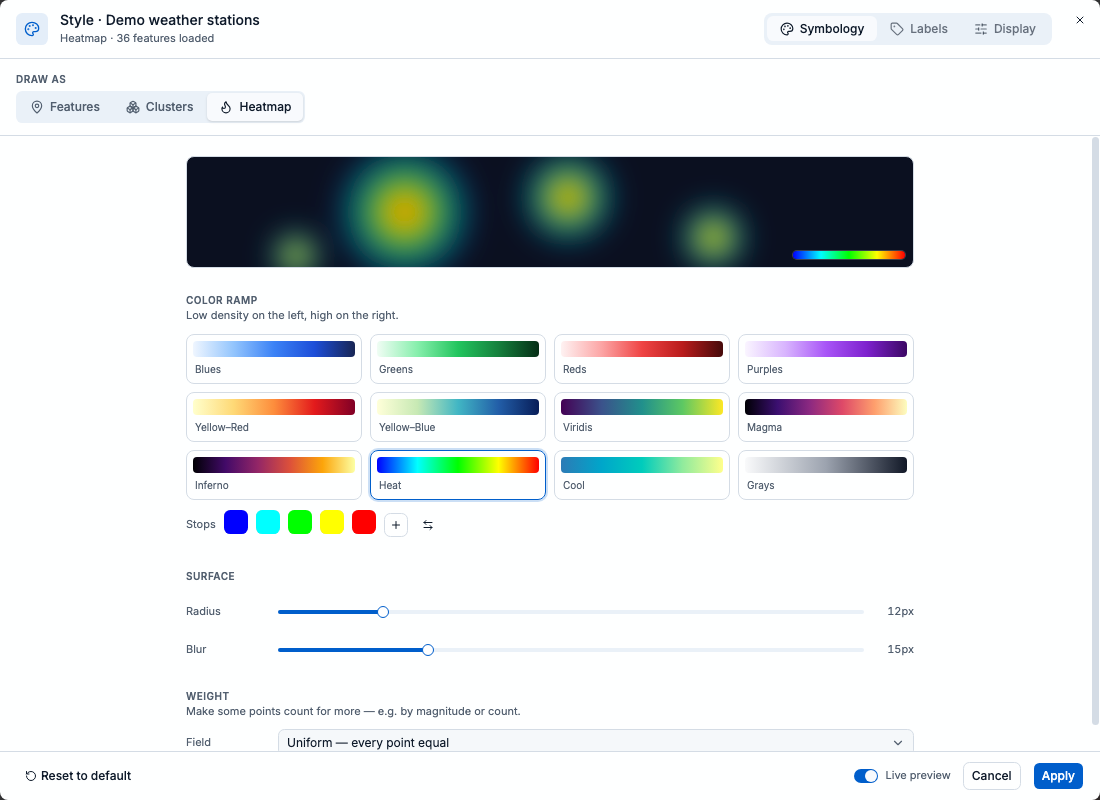
Heatmap provides a color ramp, radius, blur, and weight field. This example uses uniform weighting, so every point counts equally.
Add labels and control visibility
In Labels, enable Show labels and choose a useful field, such as a name. Adjust size, color, and halo for contrast. Use Avoid overlap and From zoom to keep the map readable.
- In Display, adjust Opacity and Visible zoom range. If a layer disappears, check whether you are outside its allowed zoom range.
- Check the map both close up and zoomed out before applying. A label that works for ten points may be cluttered for a thousand.
- If you use a saved area to define your study region, keep its outline visible for context. Apply styles, then save a project to keep the finished map setup.
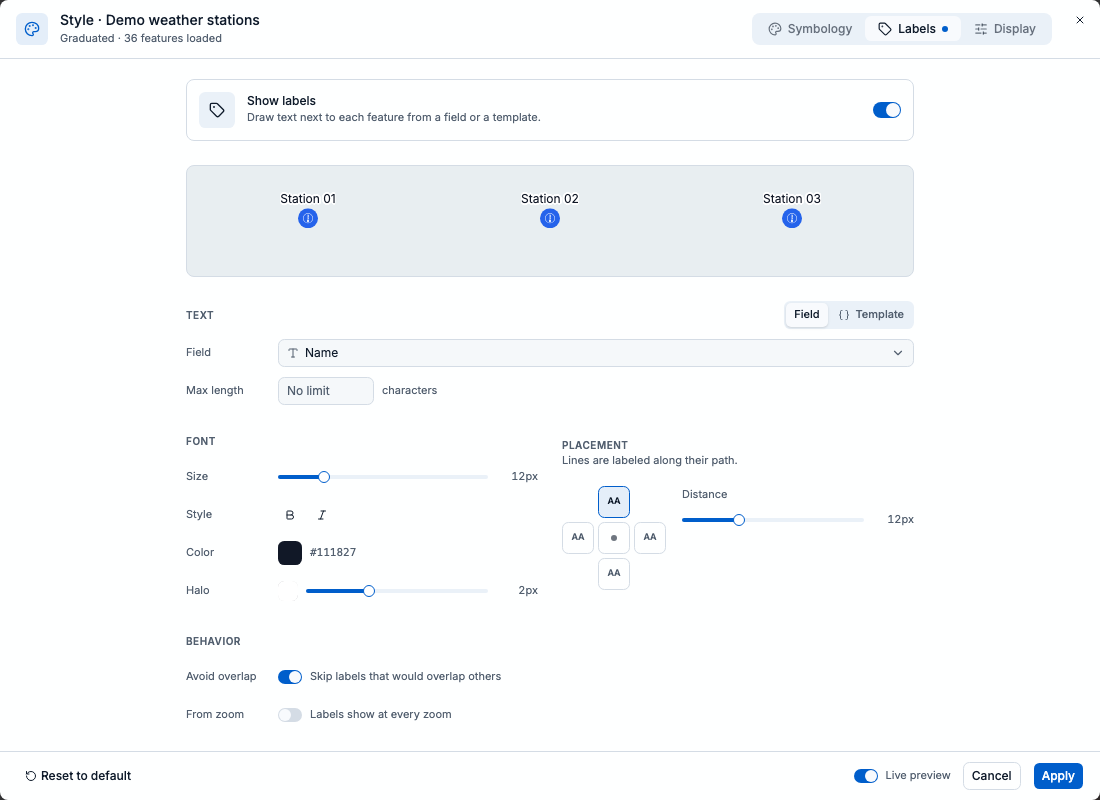
Show labels is enabled for the Name field, with a white halo and Avoid overlap turned on. The preview lets you check text contrast before applying.