Explore data
Analyze a data source
Explore records in a table, locate them on the map, and summarize a field.
Open the data analyzer
Add a feature layer, then open View → Data analyzer. Choose a layer from the analyzer’s layer picker. Supported sources include ArcGIS features, imported GeoJSON features, and data feeds with an attribute data source. Unsupported layers show a reason in the picker.
Find and inspect records
Each row represents a feature; each column is one of its attributes.
- Type in Search attributes and select Search or press Enter. To clear the search, empty the field and submit again.
- Click a sortable column header to change the order. Use the page controls to move through the results.
- Select a row to select its feature. Double-click the row or select Zoom to to locate it on the map.
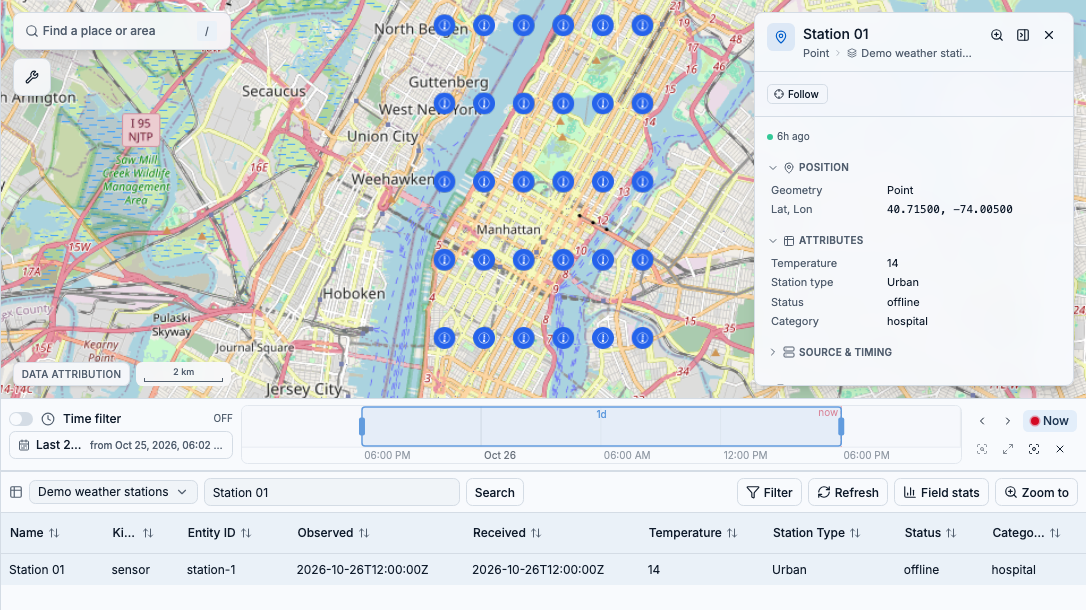
Searching for Station 01 leaves one matching row. Selecting it opens the same feature’s attributes on the map. Shown with synthetic sample observations.
Narrow the table
Select Filter, add conditions, then select Apply. The table filter narrows the results without changing the map’s saved layer query. To remove it, select Clear table filter and Apply. To change the map as well, use Edit layer query.
Get a feel for a field
Select Field stats when available, then choose a field from the statistics panel or select a column header. Start with the row count and empty values to understand how complete the data is.
- Numeric fields can show minimum, maximum, mean, standard deviation, and a histogram.
- Other summaries include distinct values, common values, and date ranges, depending on the field and source.
- Statistics follow the current search and filter across matching rows, not just the visible page. For sources analyzed on your device, that still means the records loaded by the layer, not the provider’s entire dataset.
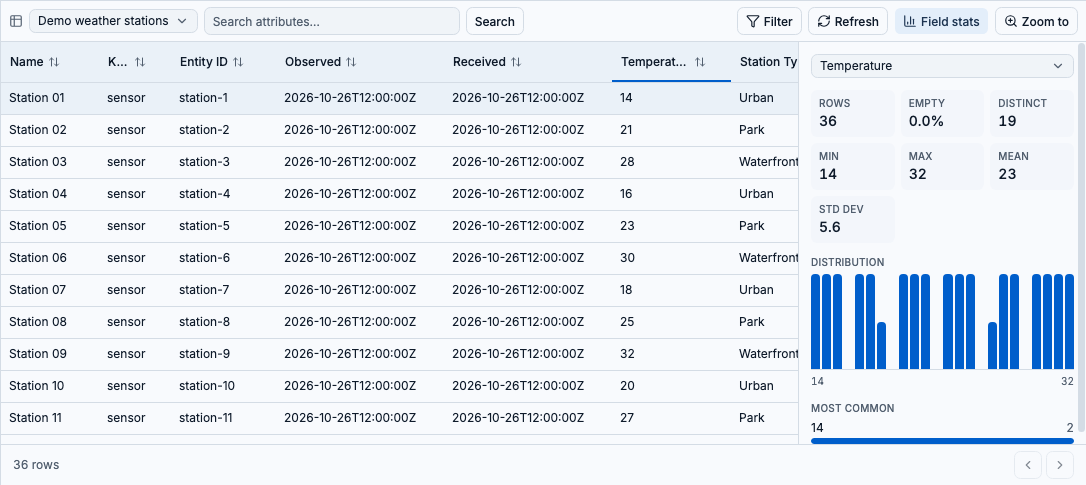
With the search cleared, Temperature summarizes all 36 sample records: values range from 14 to 32, with a mean of 23. The histogram shows how they are distributed.
Know what you’re looking at
ArcGIS tables request records from the service. Other supported layers can analyze the features already loaded into the app. Read any notices about limits or incomplete results before treating a count or average as a summary of the whole source.
- For live tables, select Live to pause on a snapshot while you inspect it, then Resume to follow updates again.
- Use Refresh to request an updated table when it is not paused.
- If the table is empty, check the layer query, time window, search, and table filter. Switching layers resets the table’s search, sort, and filter.